

Next: Parameters of the
Up: Windows of XGUI
Previous: Graph Window

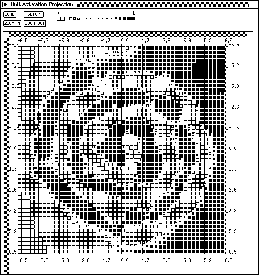
Figure: PROJECTION panel for the 2-spirals problem.
Note that the input range of the X and Y units must be specified,
not the output range. In contrast, the output range of the third
unit specified determines the color. Here the following values
have been used: X-axis: unit 1 value range -6.5 to 6.5; Y-axis:
unit 2 value range -6.5 to 6.5; activation pattern: unit 38 <the
only output unit of the network> value range 0 to 1
The projection analysis tool allows to display how the output of one
unit (e.g. a hidden or an output unit) depends on two input
units. It thus realizes a projection to two input vector axes.
It can be called with the XGUI button in the info panel by
selecting the menu item PROJECTION. The display of the
projection panel is similar to the weights display, from which it is
derived.
in the setup panel, two units must be specified, whose inputs are
varied over the given input value range to give the X resp. Y
coordinate of the projection display. The third unit to be specified
is the one whose output value determines the color of the points with
the given X and Y coordinate values. The range for the color
coding can be specified as output range. For the most common logistic
activation function this range is  .
.
The use of the other buttons,  ,
,  and
and
 are analogous to the weight display and should be obvious.
The projection tool is very instructive with the 2-spirals problem,
the XOR problem or similar problems with two-dimensional input. Each
hidden unit or output unit can be inspected and it can be determined,
to which part of the input space the neuron is sensitive. Comparing
different networks trained for such a problem by visualizing to which
part of the input space they are sensitive gives insights about the
internal representation of the networks and sometimes also about
characteristics of the training algorithms used for training. A
display of the projection panel is given in figure  .
.


Next: Parameters of the
Up: Windows of XGUI
Previous: Graph Window
Niels Mache
Wed May 17 11:23:58 MET DST 1995

 .
.
 ,
,  and
and
 are analogous to the weight display and should be obvious.